
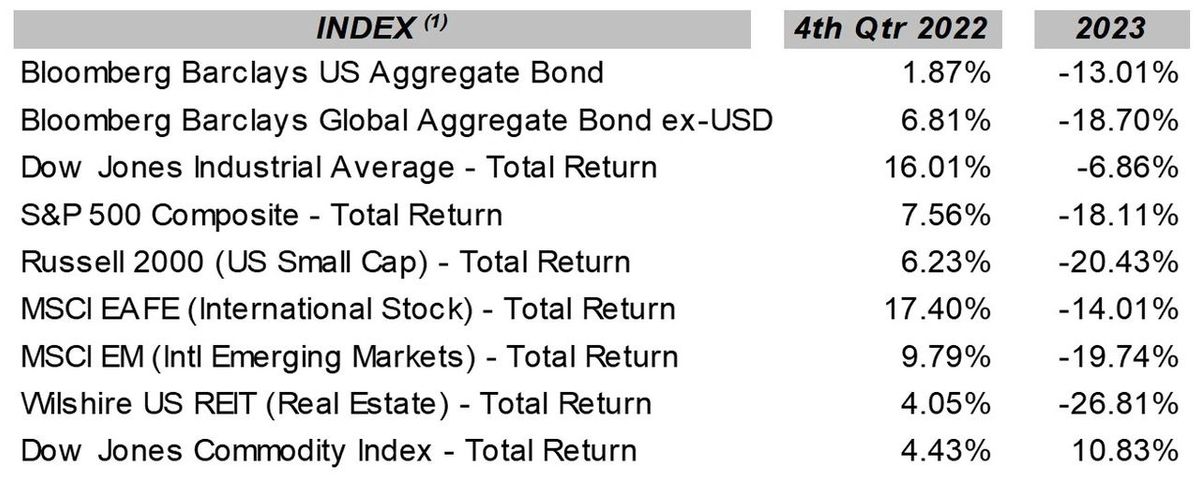
The calendar year 2022 was one for the record books for the financial markets. The US bond market as measured by the Bloomberg US Aggregate Bond Index had the worst returns in its history, while US stocks as measured by the S&P 500 index suffered the third worst returns since 1976, surpassed only in 2002 and 2008. Whether it was small cap, large cap, real estate, international or domestic, most asset classes suffered negative returns in 2022, with one bright spot being commodities, which was reflecting the inflationary pressures that were impacting the globe. The surge in global inflation, rooted primarily in excessive growth in the money supply and exacerbated by continued supply chain restrictions, forced the US Fed and other central banks to vigorously raise interest rates in 2022, with the US Fed Funds rate raising from 0.08% to 4.33%. This dramatic rise in interest rates in 2022 was the chief (but not sole) cause of the repricing in both stocks and bonds, and hence the negative returns for the year. Representative domestic and global index returns (total returns including the reinvestment of interest and dividends) for the fourth quarter of 2022 and the 2022 calendar year are shown in the following table- (these represent index returns (2)for several asset classes and not for your portfolio, and are for informational purposes only):
Bright spot
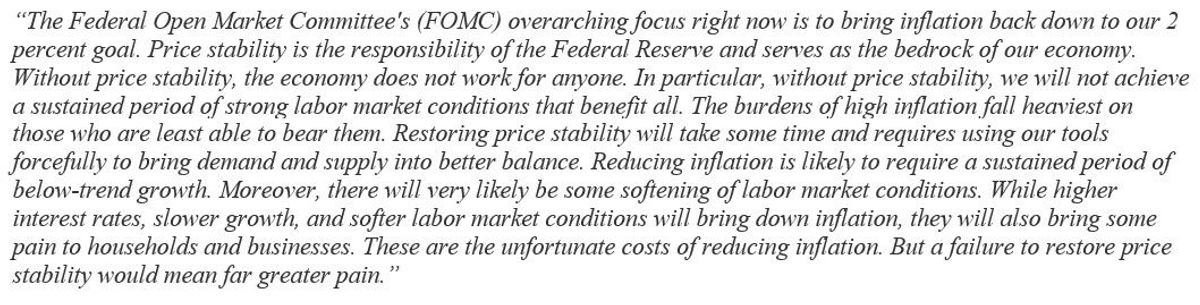
The bright spot for 2022 was indeed the fourth quarter which saw returns across many asset classes climb from their lows, as reflected in the above chart. Buyers started returning to the investment markets in hope that most of the interest rate increases by the Fed to combat inflation are in the rearview mirror, and that the Fed will “pivot” in 2023 with a change in policy from tightening to easing. Further inversion of the yield curve allowed for some positive returns in bonds as intermediate and longer-term yields declined. However, we are not out of the woods yet, and investor optimism, which is spreading into the first quarter of 2023, may be a bit premature. Fed policies of higher rates and reductions in the money supply (M2) appear to be getting the desired result of reducing inflation, with the inflation rate dropping from its high of 9.1% in June to 6.5% in December (CPI – non-seasonally adjusted). The Fed is clear that its inflation target is 2.0%, so there is still significant work to be done. It has also made it clear that it will do whatever is necessary to get to the 2.0% inflation target. At the annual Fed meeting in Jackson Hole this past August, Fed chairman Powell stated:
The Fed
It is this “sustained period of below trend growth” and “pain to households and businesses” that the current markets may not be significantly discounting in current asset prices. The Fed has not made it clear where short-term interest rates will peak, although Fed officials have recently projected rates peaking in 2023 in the 5.25% to 5.50% range. As for when the Fed will begin to lower rates, Chairman Powell has indicated that no cuts would be considered by the committee until inflation was shown to be moving toward the 2.0% target in a sustained manner. As history shows, the Fed’s past cycles of raising rates have consistently pushed the US economy into recession. Powell has eluded in so many words to the possibility of a coming recession because of the current restrictive policies, which the Fed feels are necessary to suppress demand. The growing consensus amongst economists is that we will indeed see a recession in 2023 or early 2024, but there are disagreements as to how deep and how long the upcoming recession will be. Certain economic and market indicators are flashing recession warnings, but the labor market has not weakened materially as would be expected leading into a recession, and this is leading some to believe that either we can avoid a recession (the Fed’s “soft landing”), or the recession will be mild. However, will this be the last shoe to drop? Time will tell.
Impossible to forecast
Overall, these are “unprecedented times” as Brian Wesbury, the well-known and respected chief economist at First Trust Advisors has stated repeatedly over the past 24 months. Since the Great Recession in 2008-09, Brian has been spot-on in his economic and related market forecasts, and that has earned him the right for his opinions to be thoroughly considered. At a conference I attended last week, Mr. Wesbury, whose career spans the past 40 years, stated “I have never seen a more difficult time to forecast.” Considering this comment, Mr. Wesbury is forecasting a recession in 2023. Although labeled a “Perma-Bull” for years for his optimistic forecasts for the equity markets, Mr. Wesbury is now bearish overall on US stocks in 2023, with a key reason being that investors have not yet taken into consideration the decline in corporate profits that he expects for 2023 due to the slowing US and global economies.
Sooner rather than later
The Bespoke Investment Group, a purveyor of timely economic and investment market data to which we subscribe, has consistently been optimistic in its outlook over the past decade. However, in their 2023 Outlook published in December 2022, Bespoke has turned a bit dour with a recession forecast, a view they support through current data and from past economic cycles. They state:

The "R" word
Dr. Gary Shilling, the well-respected economist, is predicting a recession, as are most major US banks, including JP Morgan, Citigroup, and Wells Fargo, and the list could go on. So, the “R” word is out on the streets and is no surprise. The real question is whether this recession reality has been fully factored into corporate earnings and subsequently into stock valuations.
There is good news
The bad news is that 2022 was a nasty year in terms of investment returns and there will be a recession soon. But there is good news. Bond yields have risen to levels that are accretive to portfolio returns without sacrificing credit quality, something that we have not seen for more than a decade. The bond markets are being set up for significant returns when the Fed eventually will lower interest rates (the yield curve is suggesting that this could be sooner than later). Stock valuations have fallen to levels that are setting up portfolios for substantially better long-term returns. There is value returning to certain markets, particularly international and emerging market stocks. It is good to remember that whenever there is bad news, there is typically always opportunity. This year will be one of continued volatility in investment markets, and stock lows may again be tested, but overall things are being set up for better returns ahead.
About the Author
Wyn Hill CFP® is the owner of Stewardship Concepts Financial Services and a financial advisor in Spokane, Washington who serves others through financial planning and investment management.
Resources:
More information on this history of the bond market: Link
Bureau of Labor Statistics: Link
Inflation and Consumer spending: Link
Enclosures:
(1)
The Barclays U.S. Aggregate Indexis an index comprised of approximately 6,000 publicly traded bonds including U.S. government, mortgage-backed, corporate and Yankee bonds with an average maturity of approximately 10 years. The index is weighted by the market value of the bonds included in the index. This index is a broad-based benchmark that measures the investment grade, U.S. dollar-denominated, fixed-rate taxable bond market, including Treasuries, government-related and corporate securities, MBS (agency fixed-rate and hybrid ARM pass-through, ABS, and CMBS. This index represents asset types which are subject to risk, including loss of principal.
The Bloomberg Barclays Global Aggregate Bond ex-USD Total Return Index is a broad-based measure of the global investment grade fixed-rate debt markets.
Dow Jones Industrial Average Total ReturnIndex is an unmanaged overall price-weighted average return, including reinvested dividends, attained by a diversified group of 30 major industry blue chip companies based in the U.S., whose value accounts for over one-fourth the value of the stocks listed on the New York Stock Exchange. This index is a total return index which means that dividends are reinvested into the index value. The stocks represented in this index may experience loss of invested principal and are subject to investment risk.
S & P 500 Composite Total Returnis an unmanaged market capitalization weighted price index composed of 500 widely held common stocks listed on the New York Stock Exchange, American Stock Exchange and Over-The-Counter market. The index includes dividends reinvestments. Effective January 1, 1988 Standard 7 Poor’s calculates the Total Return – return including reinvestment of dividends – on the S & P 500 Index on a daily basis. The value of the index varies with the aggregate value of the common equity of each of the 500 companies. The stocks represented by this index involve investment risks which may include the loss of principal investment.
Russell 2000 Index is an unmanaged, capitalization-weighted index of domestic small-cap stocks. It measures the performance of the 2,000 smallest publicly traded U.S. companies in the Russell 3000 index. Russell® is a trademark of Russell Investment Group.
The MSCI EAFE Total Return Index, reported in U.S. dollars, based on share prices and reinvested gross dividends of approximately 1100 companies (only those securities deemed sufficiently liquid for trading by investors) from the following 20 countries Australia, Austria, Belgium, Denmark, Finland, France, Germany, Hong Kong, Ireland, Italy, Japan, Malaysia, Netherlands, New Zealand, Norway, Singapore, Spain, Sweden, Switzerland, and the United Kingdom. The securities represented in this index may be subject to investment risk, currency rate risk, economic and monetary policy risk, differences in auditing standards and risks related to political and economic developments.
The MSCI EM Total Return Index is a U.S. dollar denominated index comprised of stocks of countries with below average per capita GDP as defined by the World Bank, foreign ownership restrictions, a lax regulatory environment, and greater perceived market risk than in the developed countries. Within this index, MSCI aims to capture an aggregate of 60% of local market capitalization. Prior to 1988, the data represents the IFC Global Emerging Markets index. The securities represented by this index involve investment risks which may include the loss of principal invested. This index is a total return index which means that dividends are reinvested into the index value. The index is also a benchmark index for emerging market funds (mutual funds, incubated funds, variable annuities, offshore funds, closed-end funds and variable life funds).
The Wilshire US REIT Index measures US publicly traded Real Estate Investment Trusts. This index is a subset of The Dow Jones Wilshire Real Estate Securities Index (WRESI). The index is weighted by both full market capitalization and float-adjusted market capitalization.
The Bloomberg/Dow Jones Commodity Index is an index based on 22 commodities, derived from pricing on contracts which trade on exchanges that call for a cash commodity to be delivered or received at a specific future date, place, and price. Due to market fluctuation, the commodities represented by this index may experience loss of invested principal, as they are subject to investment risk. This index is the total return version of the index and the dividends are reinvested.
(2)
All index return data has been obtained from Envestnet/Tamarac and is believed to be accurate and reliable but cannot be guaranteed. This data is presented for informational purposes only and is not a prediction or guarantee of future portfolio returns.
(3)
As an investment advisor, one of my responsibilities is to communicate with clients in an open and direct manner. Insofar as some of my opinions and comments in my letters to clients are based on current expectations, they are considered “forward-looking statements” which may or may not be accurate over the long term. While I believe I have a reasonable basis for my comments and I have confidence in my opinions, actual results may differ materially from those I anticipate. You can identify forward-looking statements by words, such as “believe”, “expect”, “may”, “anticipate”, and other similar expressions when discussing prospects for particular portfolio holdings and/or the markets, generally. I cannot, however, assure future results and disclaim any obligation to update or alter any forward-looking statements, whether as a result of new information, future events, or otherwise. Further, information provided in this letter should not be construed as a recommendation to purchase or sell any particular security.


