
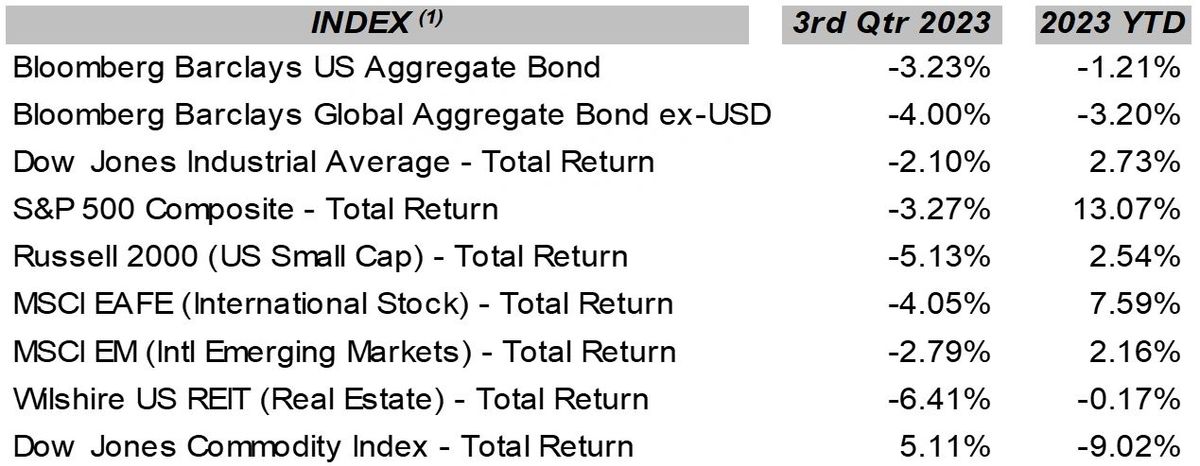
A significant rise in US longer-term interest rates during the third quarter, in combination with increased signs of slowing of the US and global economies and rising recession concerns, spooked the investment markets, resulting in negative returns for the quarter across most asset classes. The yield of the US 10-year treasury note increased by almost 1.0% during the quarter, approaching 5.0% for the first time since 2007. It is important to note that the key driver to the S&P 500 returns in 2023 is the performance of the eight largest stocks in the index, all tech companies associated with the AI frenzy, and which represent about 30% of the total capitalization of the index when combined. The average year-to-date performance of the remaining 492 stocks is either flat or down. Representative domestic and global index returns (total returns including the reinvestment of interest and dividends) for the third quarter of 2023 and 2023 through September 30, 2023, are shown in the following table. (these represent index returns (2) and are for informational purposes only):(these represent index returns (2) for several asset classes and are for informational purposes only):
In the US, all eyes are focused on inflation, the labor markets, and the Fed. The Fed remains intent on slaying the inflation dragon, which they awoke back in 2021 due to years of easy money policies, which were only exacerbated by the trillions of dollars the US government doled out to the American people during the COVID pandemic. So far, the Fed’s tightening campaign has been effective, with the headline CPI dropping from its high of 9.1% YOY in June 2022 to 3.7% YOY in September 2023. However, inflation has shown itself to be a bit sticky as the decline has plateaued in the 3.5% to 4.0% range, with housing and services appearing to be the culprits.
The Fed is still intent on an inflation target of 2.0%, much closer than a few months ago, but it is proving challenging. As quoted in an article in the October 10 edition of Barron’s, Fed Governor Christopher Waller said at a National Press Club event, “We have reaffirmed this numerical goal repeatedly since 2012, and, in tightening monetary policy since early last year, we’ve made clear that we’re determined to bring inflation down to 2.”
This article also points out that the 2.0% inflation target was chosen and established by the Fed back in 2012 “in part because it was considered most consistent with the central bank’s dual mandate of stable prices and maximum employment.” While the Fed has lost stability in prices for the moment, employment remains resilient, with the unemployment rate at 3.8% at last print, though in a rising trend line. This tight labor market continues to drive wage inflation, particularly in the services industry, which is of some concern to the Fed. Hence, the likelihood that the Fed is not yet finished with raising the Fed Funds rate, which now sits in the 5.25 – 5.50% range. The big question investors and economists share is when the Fed will pivot from tightening to easing.
It is interesting to note that even with strong employment, real disposable income growth has been flat due to inflation. Consumer savings and the consumer savings rate have plummeted, while consumer debt levels are rising, indicating that the average consumer is having trouble making ends meet. Although employment remains resilient in the US, all is not rosy on the economic front.
The ISM (Institute for Supply Management) PMI (purchasing manager index) for manufacturing and the S&P Global US Manufacturing index both show continued contraction in manufacturing globally based on September data. In contrast, the PMI for services shows continued growth in the US and globally, but global growth is beginning to stagnate. The National Federation of Independent Business (NFIB) reports increasing concerns amongst small business owners in the US. Bill Dunkleberg, chief economist for NFIB, states: “Owners remain pessimistic about future business conditions, which has contributed to the low optimism they have regarding the economy. Sales growth among small businesses have slowed and the bottom line is being squeezed, leaving owners few options beyond raising selling prices for financial relief.”
The Conference Board Leading Economic Index has declined for 18 consecutive months, negatively impacted by “weak new orders, deteriorating consumer expectations of business conditions, high-interest rates, and tight credit conditions.” This, among other things, leads the Conference Board to forecast “a challenging growth period and possible recession over the next year.” The September Conference Board Economic Forecast for the US Economy states: “The Conference Board forecasts that US economic growth will buckle under mounting headwinds early next year, leading to a very short and shallow recession. This outlook is associated with numerous factors, including, elevated inflation, high interest rates, dissipating pandemic savings, mounting consumer debt, lower government spending, and the resumption of mandatory student loan repayments. We forecast that real GDP will grow by 2.2 percent in 2023, and then fall to 0.8 percent in 2024.”
Recession forecasts continue to appear in numerous economic reports these days, with significant discrepancies in the expected timing and magnitude. As an example of the uncertainty around and difficulty in forecasting a recession, the JP Morgan Asset Management economic and market update for the fourth quarter of 2023 states in a somewhat non-committal fashion: “Overall, the U.S. economy should continue to grow at a moderate but slowing pace from here, and while a near-term recession is not guaranteed, a slower-moving economy will be increasingly sensitive to shocks. With risks remaining on the horizon, we see at least a 50/50 chance of a recession starting by the end of 2024, and a greater chance of a recession in 2025 if one fails to materialize earlier.”

The bottom line is that the Fed is intent on reducing inflation to its 2.0% target, and they are willing to do “whatever it takes” to attain this goal. In the past, Fed tightening policies have led the US economy into a recession in ten of the eleven past occurrences. Consequently, the odds of a recession within the next 12- 18 months remain pretty high, and this fact continues to incite investor nervousness, which will be reflected in increased market volatility and downward pressures on stock valuations moving forward.
There is another elephant in the room that impacts both US and global financial markets, and this is US government debt levels and deficit spending, which are interrelated. In the October 2 edition of his Monday Morning Outlook, Brian Wesbury, the chief economist for First Trust Advisors, opines: The fiscal year ended last week, alarms went off both literally and figuratively, and a last-minute deal was reached to keep the government open for another forty-five days. Later in October the Treasury Department will figure out the final budget numbers for last year and we estimate the deficit will come in a little north of $1.7 trillion, or 6.5% of GDP. In a fiscal year when unemployment averaged only 3.6%, that’s a horribly high budget deficit to run, and a sign that something is deeply wrong with US fiscal policy. Worse, this past year’s deficit was artificially and temporarily held down by the Supreme Court striking down much of President Biden’s plan to forgive student debt. Without that decision, the deficit would have been close to 8% of GDP.
The bottom line is that the US is approaching a fiscal reckoning sometime in the next few years where it will need to either reduce future spending or find more future revenue. Even tougher, this will have to happen in a geo-political backdrop where the US may have to ramp up military spending to project more power in the Pacific...
Mr. Wesbury ends with the following, “The one thing we know for sure is the US is on an unsustainable path.” With rising interest rates, the cost to the US Government, or more accurately to the American people, of carrying $33 Trillion of debt continues to climb as a percentage of GDP and total government revenue. Irresponsible spending and burgeoning debt levels will only serve to restrict future US economic growth and future financial stability. How our Congressional representatives handle this in the near term is paramount to the future of this nation.
We are in unprecedented and trying times, to be sure. To repeat verbatim what I stated last quarter, we are coming out of an extended period of policy-induced monetary and fiscal excesses, some COVID-related and some in response to the Great Recession in 2008-2009. These excesses triggered inflation, overleveraging, speculation, and overvaluation in many asset classes, and it takes time for these excesses to be worked out of the global financial system unless policies allow them to continue, which would be unfortunate. We are headed into a recession within the next 12 to 18 months, directly impacting the economy, corporate earnings, and, therefore, stock valuations somewhat. The unknown is the length and severity of the recession. However, higher interest rates still provide higher returns from bonds, are more representative of historical bond returns, and can be accretive to portfolio returns and portfolio stability moving forward. Expecting more volatility this year, we favor hedging a portion of our stock exposure against stock declines, holding quality, and extending the bond duration to lock in high yields. As always, remain fully invested.
If you have any questions concerning any portion of this report or the current investment markets, please do not hesitate to call.
About the Author
Wyn Hill CFP® is the owner of Stewardship Concepts Financial Services and a financial advisor in Spokane, Washington who serves others through financial planning and investment management.
Resources:
What causes a recession: Link
Why Millennials are the unluckiest generation: Link
Inflation and Consumer Spending: Link
Enclosures (1)
1 The Barclays U.S. Aggregate Index is an index comprised of approximately 6,000 publicly traded bonds including U.S. government, mortgage-backed, corporate and Yankee bonds with an average maturity of approximately 10 years. The index is weighted by the market value of the bonds included in the index. This index is a broad-based benchmark that measures the investment grade, U.S. dollar-denominated, fixed-rate taxable bond market, including Treasuries, government-related and corporate securities, MBS (agency fixed-rate and hybrid ARM pass-through, ABS, and CMBS. This index represents asset types which are subject to risk, including loss of principal.
The Bloomberg Barclays Global Aggregate Bond ex-USD Total Return Index is a broad-based measure of the global investment grade fixed-rate debt markets.
Dow Jones Industrial Average Total Return Index is an unmanaged overall price-weighted average return, including reinvested dividends, attained by a diversified group of 30 major industry blue chip companies based in the U.S., whose value accounts for over one-fourth the value of the stocks listed on the New York Stock Exchange. This index is a total return index which means that dividends are reinvested into the index value. The stocks represented in this index may experience loss of invested principal and are subject to investment risk.
S & P 500 Composite Total Return is an unmanaged market capitalization weighted price index composed of 500 widely held common stocks listed on the New York Stock Exchange, American Stock Exchange and Over-The-Counter market. The index includes dividends reinvestments. Effective January 1, 1988 Standard 7 Poor’s calculates the Total Return – return including reinvestment of dividends – on the S & P 500 Index on a daily basis. The value of the index varies with the aggregate value of the common equity of each of the 500 companies. The stocks represented by this index involve investment risks which may include the loss of principal investment.
Russell 2000 Index is an unmanaged, capitalization-weighted index of domestic small-cap stocks. It measures the performance of the 2,000 smallest publicly traded U.S. companies in the Russell 3000 index. Russell® is a trademark of Russell Investment Group.
The MSCI EAFE Total Return Index, reported in U.S. dollars, based on share prices and reinvested gross dividends of approximately 1100 companies (only those securities deemed sufficiently liquid for trading by investors) from the following 20 countries Australia, Austria, Belgium, Denmark, Finland, France, Germany, Hong Kong, Ireland, Italy, Japan, Malaysia, Netherlands, New Zealand, Norway, Singapore, Spain, Sweden, Switzerland, and the United Kingdom. The securities represented in this index may be subject to investment risk, currency rate risk, economic and monetary policy risk, differences in auditing standards and risks related to political and economic developments.
The MSCI EM Total Return Index is a U.S. dollar denominated index comprised of stocks of countries with below average per capita GDP as defined by the World Bank, foreign ownership restrictions, a lax regulatory environment, and greater perceived market risk than in the developed countries. Within this index, MSCI aims to capture an aggregate of 60% of local market capitalization. Prior to 1988, the data represents the IFC Global Emerging Markets index. The securities represented by this index involve investment risks which may include the loss of principal invested. This index is a total return index which means that dividends are reinvested into the index value. The index is also a benchmark index for emerging market funds (mutual funds, incubated funds, variable annuities, offshore funds, closed-end funds and variable life funds).
The Wilshire US REIT Index measures US publicly traded Real Estate Investment Trusts. This index is a subset of The Dow Jones Wilshire Real Estate Securities Index (WRESI). The index is weighted by both full market capitalization and float-adjusted market capitalization.
The Bloomberg/Dow Jones Commodity Index is an index based on 22 commodities, derived from pricing on contracts which trade on exchanges that call for a cash commodity to be delivered or received at a specific future date, place, and price. Due to market fluctuation, the commodities represented by this index may experience loss of invested principal, as they are subject to investment risk. This index is the total return version of the index and the dividends are reinvested.
2 All index return data has been obtained from Envestnet/Tamarac and is believed to be accurate and reliable but cannot be guaranteed. This data is presented for informational purposes only and is not a prediction or guarantee of future portfolio returns.
3 As an investment advisor, one of my responsibilities is to communicate with clients in an open and direct manner. Insofar as some of my opinions and comments in my letters to clients are based on current expectations, they are considered “forward-looking statements” which may or may not be accurate over the long term. While I believe I have a reasonable basis for my comments and I have confidence in my opinions, actual results may differ materially from those I anticipate. You can identify forward-looking statements by words, such as “believe”, “expect”, “may”, “anticipate”, and other similar expressions when discussing prospects for particular portfolio holdings and/or the markets, generally. I cannot, however, assure future results and disclaim any obligation to update or alter any forward-looking statements, whether as a result of new information, future events, or otherwise. Further, information provided in this letter should not be construed as a recommendation to purchase or sell any particular security.


