
In the second quarter of 2023, despite concerted efforts by the Federal Reserve and other global central banks to raise short-term interest rates and combat inflation, stock returns remained positive across major US and international indices. Growth stocks took the lead, while bonds faced challenges due to rising interest rates. Economic indicators presented a mixed picture, with signs pointing to a potential recession and some positive developments in the labor market and housing sector. The ongoing uncertainty surrounding the Fed's interest rate hikes and conflicting opinions among economists contribute to market volatility. As corporate earnings reports for the second quarter emerge, they will significantly guide investment decisions. Additionally, the concentration of returns in a few tech companies highlights the importance of considering market breadth. Amidst these factors, investors should prepare for potential volatility and view hedging strategies and quality holdings. If you are worried about your investments, schedule a free call with one of our Spokane financial advisors to discuss how we can help navigate this investment market.
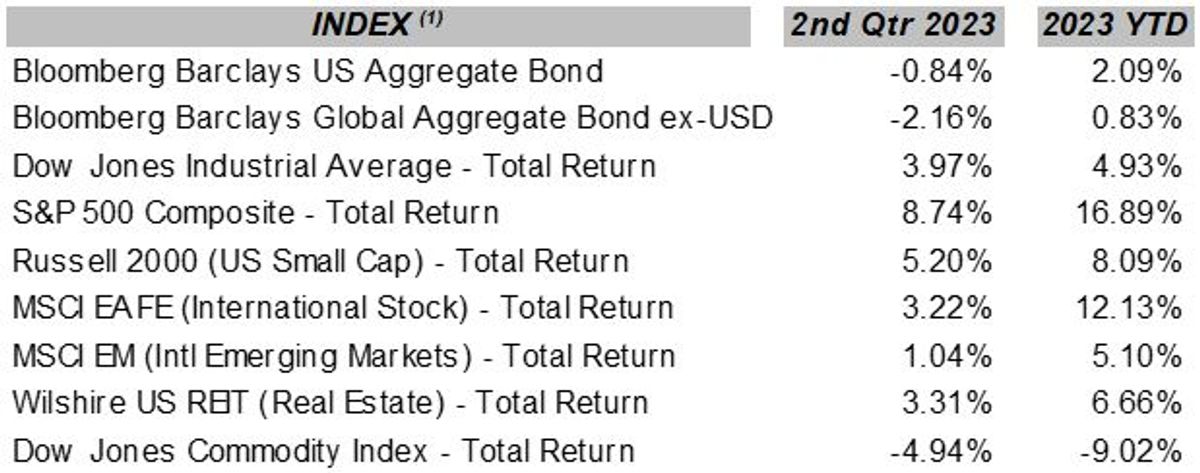
The concerted efforts of the Federal Reserve and other global central banks to continue to raise short-term interest rates to reduce inflation did not stand in the way of stock returns in the second quarter. The major US and global stock indices showed positive returns across the capitalization range from small cap to large cap, with growth stocks leading the way. Bonds, however, faired a bit differently due to the return to rising interest rates in the second quarter, which took a bite out of the positive bond returns seen in the first quarter from previously falling rates. Representative domestic and global index returns (total returns including the reinvestment of interest and dividends) for the second quarter of 2023 and 2023 through June 30, 2023, are shown in the following table (these represent index returns (2) for several asset classes and are for informational purposes only):(these represent index returns (2)for several asset classes, and are for informational purposes only):
The Fed remains focused on doing whatever is necessary to reduce inflation to its target of 2.0%. Although they paused at their last meeting, the Fed anticipates more increases to the Fed funds rate, now in the 5.00% - 5.25% range. In addition to raising rates, the Fed has been aggressively reducing the money supply, which ballooned by 40% due to the massive government stimulus during the COVID pandemic and was the leading factor leading to the spike in inflation in 2022. The money supply now has seen the largest drop since the Great Depression. The Fed’s efforts are having a positive effect, with the headline CPI dropping from its high of 9.1% YOY in June 2022 to 4.1% YOY in May 2023. However, it is anticipated that inflation may be more difficult to tame than anticipated because of continued strength in the labor market, rising wage pressures, low unemployment, and a forecast of higher energy costs moving forward. Hence, the Fed’s announcement of additional interest rate hikes shortly and the continued uncertainty around how high rates will go.
A historical review of the Fed’s current monetary policies would indicate a recession in the cards, and signs suggest this may be so. The yield curve remains strongly inverted; the leading economic indicators have been in a downward trend (although there was a slight uptick in May), and the US Manufacturing PMI (purchasing managers index) remains in contraction territory, strongly suggesting that supply is exceeding demand, commercial and industrial loan growth is contracting due to tougher lending standards and higher rates by financial institutions, the decline in pending home sales for three consecutive months, consumer’s future expectations remaining weak, the use of revolving credit by consumers having risen significantly (suggesting that consumers need to borrow to cover living expenses). The NFIB Small Business Survey shows great concern by small business owners over future conditions, among other things. However, a recent rise in consumer confidence to a four-month high, six consecutive months of the Services PMI being in expansion territory, signs of renewed strength in the housing market with a surge in new home sales, the uptick in building permits and housing starts in May, and continued strength (though waning) in the labor markets are suggesting that the Fed may indeed be able to pull off a “soft landing” and avoid a recession. Current economic data has split economists and market forecasters into two camps, the first being the “soft landing is indeed possible and likely” camp, and the second being the “a recession is inevitable and is just taking longer than anticipated to arrive” camp. These conflicting opinions and the uncertainty surrounding further interest rate increases by the Fed will continue to drive volatility in the investment markets.

Corporate earnings reports for the second quarter begin in earnest this week, along with corporate revenue and earnings forecasts for the balance of the year. The data and tone of these reports will be significant in directing stock and bond investing over the balance of this year. Interestingly, as of April 28 of this year, the largest eight US stocks by market capitalization in the S&P 500 index accounted for 102% of the index’s year-to-date return. These eight stocks are Meta Platforms, Apple, Amazon, Netflix, Alphabet (Google), Microsoft, Nvidia, and Tesla, which make up roughly one-third of the S&P 500’s total market value. This indicates that at that time, the remaining 492 stocks in the index were either down or flat for the year, reflecting extremely poor market breadth, which does not bode well for future gains. These unbalanced returns were partially driven by investors’ excitement over AI and its future implementation and investors’ “fear of missing out.” However, as of June 29, market breadth had improved considerably, with almost 60% of the index’s stocks showing gains for the year, although most of the index’s total returns were concentrated in the aforementioned top eight tech companies whose valuations have become unsustainably rich. This highlights the importance of looking under the hood of an index’s returns. Market breadth is a significant factor in the sustainability of the trend in index valuations, either up or down. It, therefore, will continue to be a focus of investors during this earnings season.
To repeat what I stated last quarter, we are coming out of an extended period of policy-induced monetary and fiscal excesses, some COVID-related and some in response to the Great Recession in 2008-2009. These excesses triggered inflation, overleveraging, speculation, and overvaluation in many asset classes, and it takes time for these excesses to be worked out of the global financial system unless policies allow them to continue, which would be unfortunate. We are most likely headed into a recession within the next 12 to 18 months, which will directly impact the economy, corporate earnings, and, therefore, stock valuations to some degree. The unknown is the length and severity of the recession. However, higher interest rates still provide higher returns from bonds, are more representative of historical bond returns, and can be accretive to portfolio returns and portfolio stability moving forward. When the recession materializes, the Fed will need to respond by lowering interest rates which could lead to a massive rally in bond returns. Expect more volatility this year. We continue to hedge a portion of our stock exposure against stock market declines, favor quality holdings in our portfolios, and extend the bond duration to lock in yield where possible. As always, we remain fully invested, adhering to the target allocations of our model portfolios.
As the global financial system adjusts to the consequences of policy-induced monetary and fiscal excesses, the outlook suggests a recession may be on the horizon within the next 12 to 18 months. However, higher interest rates offer potential benefits, including higher bond returns and portfolio stability. The length and severity of the upcoming recession remain uncertain, but investors can position themselves by hedging against stock market declines, favoring quality holdings, and extending bond duration. Volatility is expected to persist, and staying fully invested while adhering to target allocations of model portfolios is advised. By closely monitoring economic indicators, corporate earnings reports, and the actions of central banks, investors can navigate the evolving market landscape with greater confidence. Schedule a free call with one of our Spokane financial advisors to discuss navigating this complicated investment time.
About the Author
Wyn Hill CFP® is the owner of Stewardship Concepts Financial Services and a financial advisor in Spokane, Washington who serves others through financial planning and investment management.
Resources:
What causes a recession: Link
Fed's interest rate: Link
Inflation and Consumer Spending: Link
Enclosures
1 The Barclays U.S. Aggregate Index is an index comprised of approximately 6,000 publicly traded bonds including U.S. government, mortgage-backed, corporate and Yankee bonds with an average maturity of approximately 10 years. The index is weighted by the market value of the bonds included in the index. This index is a broad-based benchmark that measures the investment grade, U.S. dollar-denominated, fixed-rate taxable bond market, including Treasuries, government-related and corporate securities, MBS (agency fixed-rate and hybrid ARM pass-through, ABS, and CMBS. This index represents asset types which are subject to risk, including loss of principal.
The Bloomberg Barclays Global Aggregate Bond ex-USD Total Return Index is a broad-based measure of the global investment grade fixed-rate debt markets.
Dow Jones Industrial Average Total Return Index is an unmanaged overall price-weighted average return, including reinvested dividends, attained by a diversified group of 30 major industry blue chip companies based in the U.S., whose value accounts for over one-fourth the value of the stocks listed on the New York Stock Exchange. This index is a total return index which means that dividends are reinvested into the index value. The stocks represented in this index may experience loss of invested principal and are subject to investment risk.
S & P 500 Composite Total Returnis an unmanaged market capitalization weighted price index composed of 500 widely held common stocks listed on the New York Stock Exchange, American Stock Exchange and Over-The-Counter market. The index includes dividends reinvestments. Effective January 1, 1988 Standard 7 Poor’s calculates the Total Return – return including reinvestment of dividends – on the S & P 500 Index on a daily basis. The value of the index varies with the aggregate value of the common equity of each of the 500 companies. The stocks represented by this index involve investment risks which may include the loss of principal investment.
Russell 2000 Index is an unmanaged, capitalization-weighted index of domestic small-cap stocks. It measures the performance of the 2,000 smallest publicly traded U.S. companies in the Russell 3000 index. Russell® is a trademark of Russell Investment Group.
The MSCI EAFE Total Return Index, reported in U.S. dollars, based on share prices and reinvested gross dividends of approximately 1100 companies (only those securities deemed sufficiently liquid for trading by investors) from the following 20 countries Australia, Austria, Belgium, Denmark, Finland, France, Germany, Hong Kong, Ireland, Italy, Japan, Malaysia, Netherlands, New Zealand, Norway, Singapore, Spain, Sweden, Switzerland, and the United Kingdom. The securities represented in this index may be subject to investment risk, currency rate risk, economic and monetary policy risk, differences in auditing standards and risks related to political and economic developments.
The MSCI EM Total Return Indexis a U.S. dollar denominated index comprised of stocks of countries with below average per capita GDP as defined by the World Bank, foreign ownership restrictions, a lax regulatory environment, and greater perceived market risk than in the developed countries. Within this index, MSCI aims to capture an aggregate of 60% of local market capitalization. Prior to 1988, the data represents the IFC Global Emerging Markets index. The securities represented by this index involve investment risks which may include the loss of principal invested. This index is a total return index which means that dividends are reinvested into the index value. The index is also a benchmark index for emerging market funds (mutual funds, incubated funds, variable annuities, offshore funds, closed-end funds and variable life funds).
The Wilshire US REIT Index measures US publicly traded Real Estate Investment Trusts. This index is a subset of The Dow Jones Wilshire Real Estate Securities Index (WRESI). The index is weighted by both full market capitalization and float-adjusted market capitalization.
The Bloomberg/Dow Jones Commodity Index is an index based on 22 commodities, derived from pricing on contracts which trade on exchanges that call for a cash commodity to be delivered or received at a specific future date, place, and price. Due to market fluctuation, the commodities represented by this index may experience loss of invested principal, as they are subject to investment risk. This index is the total return version of the index and the dividends are reinvested.
(2) All index return data has been obtained from Envestnet/Tamarac and is believed to be accurate and reliable but cannot be guaranteed. This data is presented for informational purposes only and is not a prediction or guarantee of future portfolio returns.
(3) As an investment advisor, one of my responsibilities is to communicate with clients in an open and direct manner. Insofar as some of my opinions and comments in my letters to clients are based on current expectations, they are considered “forward-looking statements” which may or may not be accurate over the long term. While I believe I have a reasonable basis for my comments and I have confidence in my opinions, actual results may differ materially from those I anticipate. You can identify forward-looking statements by words, such as “believe”, “expect”, “may”, “anticipate”, and other similar expressions when discussing prospects for particular portfolio holdings and/or the markets, generally. I cannot, however, assure future results and disclaim any obligation to update or alter any forward-looking statements, whether as a result of new information, future events, or otherwise. Further, information provided in this letter should not be construed as a recommendation to purchase or sell any particular security.


