
Overview
After a year of abysmal investment returns globally in both stocks and bonds in 2022, the first quarter of 2023 saw investment returns begin to climb out of the trough, a continuation of a return to positive returns that commenced in the fourth quarter of 2022. Other than commodities, US and global stocks and bonds returns ended up in the black for the first quarter, but not without volatility. Global central banks, including the Fed, continued with their synchronized policies of raising short-term interest rates to temper demand, and consequently, inflation, which is proving itself difficult to tame. Uncertainty about how long these interest rate hikes will continue and to what level rates will need to rise, along with rising recession concerns and the resulting impact on corporate earnings, have equity investors nervous, which will only lead to ongoing volatility and lack of direction in equity markets shortly.
Banking Issues
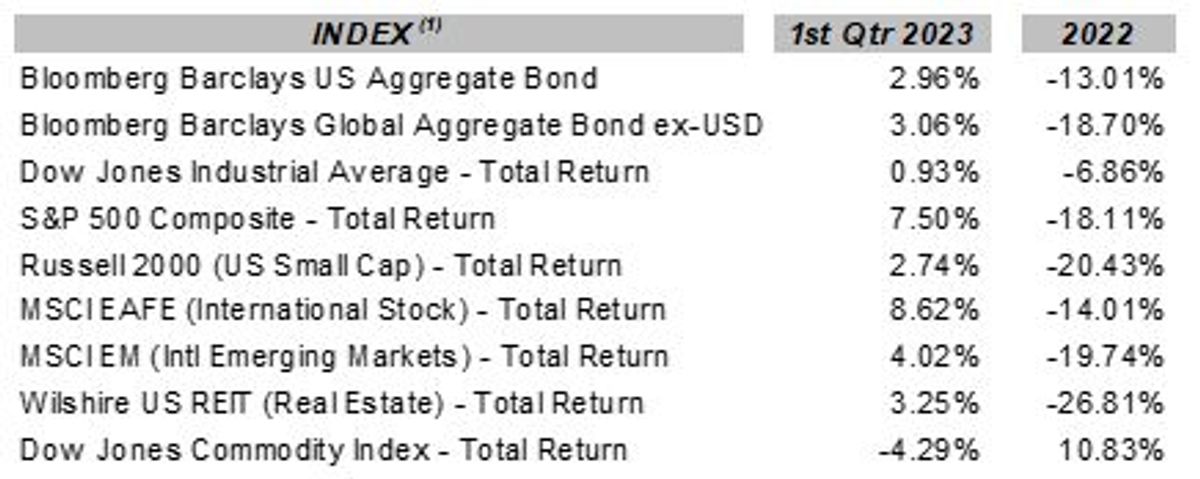
The failure of SVB and Signature Bank in the US, and that of Credit Suisse in Switzerland, are evidence of the strains that the central bank’s interest rate policies are putting on the global financial system. This, along with recession concerns, is leading bond investors to foresee lower interest rates shortly, which is reflected in a broad and significant drop in rates across the US Treasury yield curve during the later part of March. Representative domestic and global index returns (total returns including the reinvestment of interest and dividends) for the first quarter of 2023 and 2022 calendar year are shown in the following table (these represent index returns (2) for several asset classes and not for your portfolio, and are for informational purposes only):
Interest Rates & Inflation
Due to the lack of any significant changes in the market outlook so far this quarter, this commentary will be a bit briefer than normal. The Fed continues its focus on knocking inflation back down to a target level of 2.0%, and as Chairman Jerome Powell has stated on multiple occasions, the Fed will do whatever it takes to succeed in this endeavor, even if it leads to a recession and higher unemployment (which is not making some politicians very happy to hear). The Fed continues to raise short-term interest rates and reduce the money supply (something that is not broadly discussed but is very important). Since March of 2022, the Fed has raised the Fed Funds rates from essentially 0% to the current range of 4.75% - 5.00%.
This is a huge move! The inflation rate is trending lower (from a high of around 9.5% YOY in June of 2022 to a level of around 6.0% YOY in February of 2023 as measured by the CPI) but is proving to be more resilient than expected. The Fed’s favorite measure of inflation, the Personal Consumption Expenditure Price Index (PCE) came in at 5.0% YOY, still a 3.0% spread from the Fed’s target of 2.0%. As the Fed appears resolute in its task, this puts more pressure on the Fed to continue to raise rates to higher levels which in turn will put more strain on the economy. As the US economy shows signs of slowing, employment remains strong, with the unemployment rate hovering around 3.5%, again pressuring the Fed for potentially higher rates and perhaps a longer period.

Other Signs
The recent high-profile failure of two US banks (SVB and Signature Bank), and the unified bailout of a fourth (First Republic Bank), along with the failure of Credit Suisse and its orchestrated acquisition by UBS, are collectively showing the pressures that higher interest rates are having upon the financial system.
“Cracks” are developing. However, as Jamie Dimon, the CEO of JP Morgan pointed out in his latest letter to shareholders, the recent bank failures are not pervasive throughout the banking system but those that are occurring and maybe will occur are a consequence of poor management decisions at the failed institutions and a lack of regulatory oversight to some degree (political influence, perhaps).
Recession
We are coming out of an extended period of policy-induced monetary and fiscal excesses, some COVID-related and some in response to the Great Recession in 2008-2009. It is these excesses that triggered inflation, overleveraging, speculation, and overvaluation in many asset classes, and it will take some time for these excesses to be worked out of the global financial system unless policies allow them to continue which would be unfortunate. In the meantime, we are most likely headed into a recession which will directly impact the economy and corporate earnings, and therefore stock valuations to some degree.
The Good
However, higher interest rates provide higher returns from bonds, returns that are more representative of historical bond returns and which can be accretive to portfolio returns and portfolio stability moving forward. In expectation of more volatility this year, we continue to hedge a portion of our stock exposure against stock market declines, favor quality holdings in our portfolios, and extend the bond duration to lock in yield where possible.
About the Author
Wyn Hill CFP® is the owner of Stewardship Concepts Financial Services and a financial advisor in Spokane, Washington who serves others through financial planning and investment management.
Resources:
Recessions: Link
Fed's interest rate: Link
Inflation and Consumer Spending: Link
Enclosures:
1 The Barclays U.S. Aggregate Indexis an index comprised of approximately 6,000 publicly traded bonds including U.S. government, mortgage-backed, corporate and Yankee bonds with an average maturity of approximately 10 years. The index is weighted by the market value of the bonds included in the index. This index is a broad-based benchmark that measures the investment grade, U.S. dollar-denominated, fixed-rate taxable bond market, including Treasuries, government-related and corporate securities, MBS (agency fixed-rate and hybrid ARM pass-through, ABS, and CMBS. This index represents asset types which are subject to risk, including loss of principal.
The Bloomberg Barclays Global Aggregate Bond ex-USD Total Return Index is a broad-based measure of the global investment grade fixed-rate debt markets.
Dow Jones Industrial Average Total ReturnIndex is an unmanaged overall price-weighted average return, including reinvested dividends, attained by a diversified group of 30 major industry blue chip companies based in the U.S., whose value accounts for over one-fourth the value of the stocks listed on the New York Stock Exchange. This index is a total return index which means that dividends are reinvested into the index value. The stocks represented in this index may experience loss of invested principal and are subject to investment risk.
S & P 500 Composite Total Returnis an unmanaged market capitalization weighted price index composed of 500 widely held common stocks listed on the New York Stock Exchange, American Stock Exchange and Over-The-Counter market. The index includes dividends reinvestments. Effective January 1, 1988 Standard 7 Poor’s calculates the Total Return – return including reinvestment of dividends – on the S & P 500 Index on a daily basis. The value of the index varies with the aggregate value of the common equity of each of the 500 companies. The stocks represented by this index involve investment risks which may include the loss of principal investment.
Russell 2000 Index is an unmanaged, capitalization-weighted index of domestic small-cap stocks. It measures the performance of the 2,000 smallest publicly traded U.S. companies in the Russell 3000 index. Russell® is a trademark of Russell Investment Group.
The MSCI EAFE Total Return Index, reported in U.S. dollars, based on share prices and reinvested gross dividends of approximately 1100 companies (only those securities deemed sufficiently liquid for trading by investors) from the following 20 countries Australia, Austria, Belgium, Denmark, Finland, France, Germany, Hong Kong, Ireland, Italy, Japan, Malaysia, Netherlands, New Zealand, Norway, Singapore, Spain, Sweden, Switzerland, and the United Kingdom. The securities represented in this index may be subject to investment risk, currency rate risk, economic and monetary policy risk, differences in auditing standards and risks related to political and economic developments.
The MSCI EM Total Return Index is a U.S. dollar denominated index comprised of stocks of countries with below average per capita GDP as defined by the World Bank, foreign ownership restrictions, a lax regulatory environment, and greater perceived market risk than in the developed countries. Within this index, MSCI aims to capture an aggregate of 60% of local market capitalization. Prior to 1988, the data represents the IFC Global Emerging Markets index. The securities represented by this index involve investment risks which may include the loss of principal invested. This index is a total return index which means that dividends are reinvested into the index value. The index is also a benchmark index for emerging market funds (mutual funds, incubated funds, variable annuities, offshore funds, closed-end funds and variable life funds).
The Wilshire US REIT Index measures US publicly traded Real Estate Investment Trusts. This index is a subset of The Dow Jones Wilshire Real Estate Securities Index (WRESI). The index is weighted by both full market capitalization and float-adjusted market capitalization.
The Bloomberg/Dow Jones Commodity Index is an index based on 22 commodities, derived from pricing on contracts which trade on exchanges that call for a cash commodity to be delivered or received at a specific future date, place, and price. Due to market fluctuation, the commodities represented by this index may experience loss of invested principal, as they are subject to investment risk. This index is the total return version of the index and the dividends are reinvested.
2 All index return data has been obtained from Envestnet/Tamarac and is believed to be accurate and reliable but cannot be guaranteed. This data is presented for informational purposes only and is not a prediction or guarantee of future portfolio returns.
3 As an investment advisor, one of my responsibilities is to communicate with clients in an open and direct manner. Insofar as some of my opinions and comments in my letters to clients are based on current expectations, they are considered “forward-looking statements” which may or may not be accurate over the long term. While I believe I have a reasonable basis for my comments and I have confidence in my opinions, actual results may differ materially from those I anticipate. You can identify forward-looking statements by words, such as “believe”, “expect”, “may”, “anticipate”, and other similar expressions when discussing prospects for particular portfolio holdings and/or the markets, generally. I cannot, however, assure future results and disclaim any obligation to update or alter any forward-looking statements, whether as a result of new information, future events, or otherwise. Further, information provided in this letter should not be construed as a recommendation to purchase or sell any particular security.


